Loading the page
lakebrasil · 2026 elections
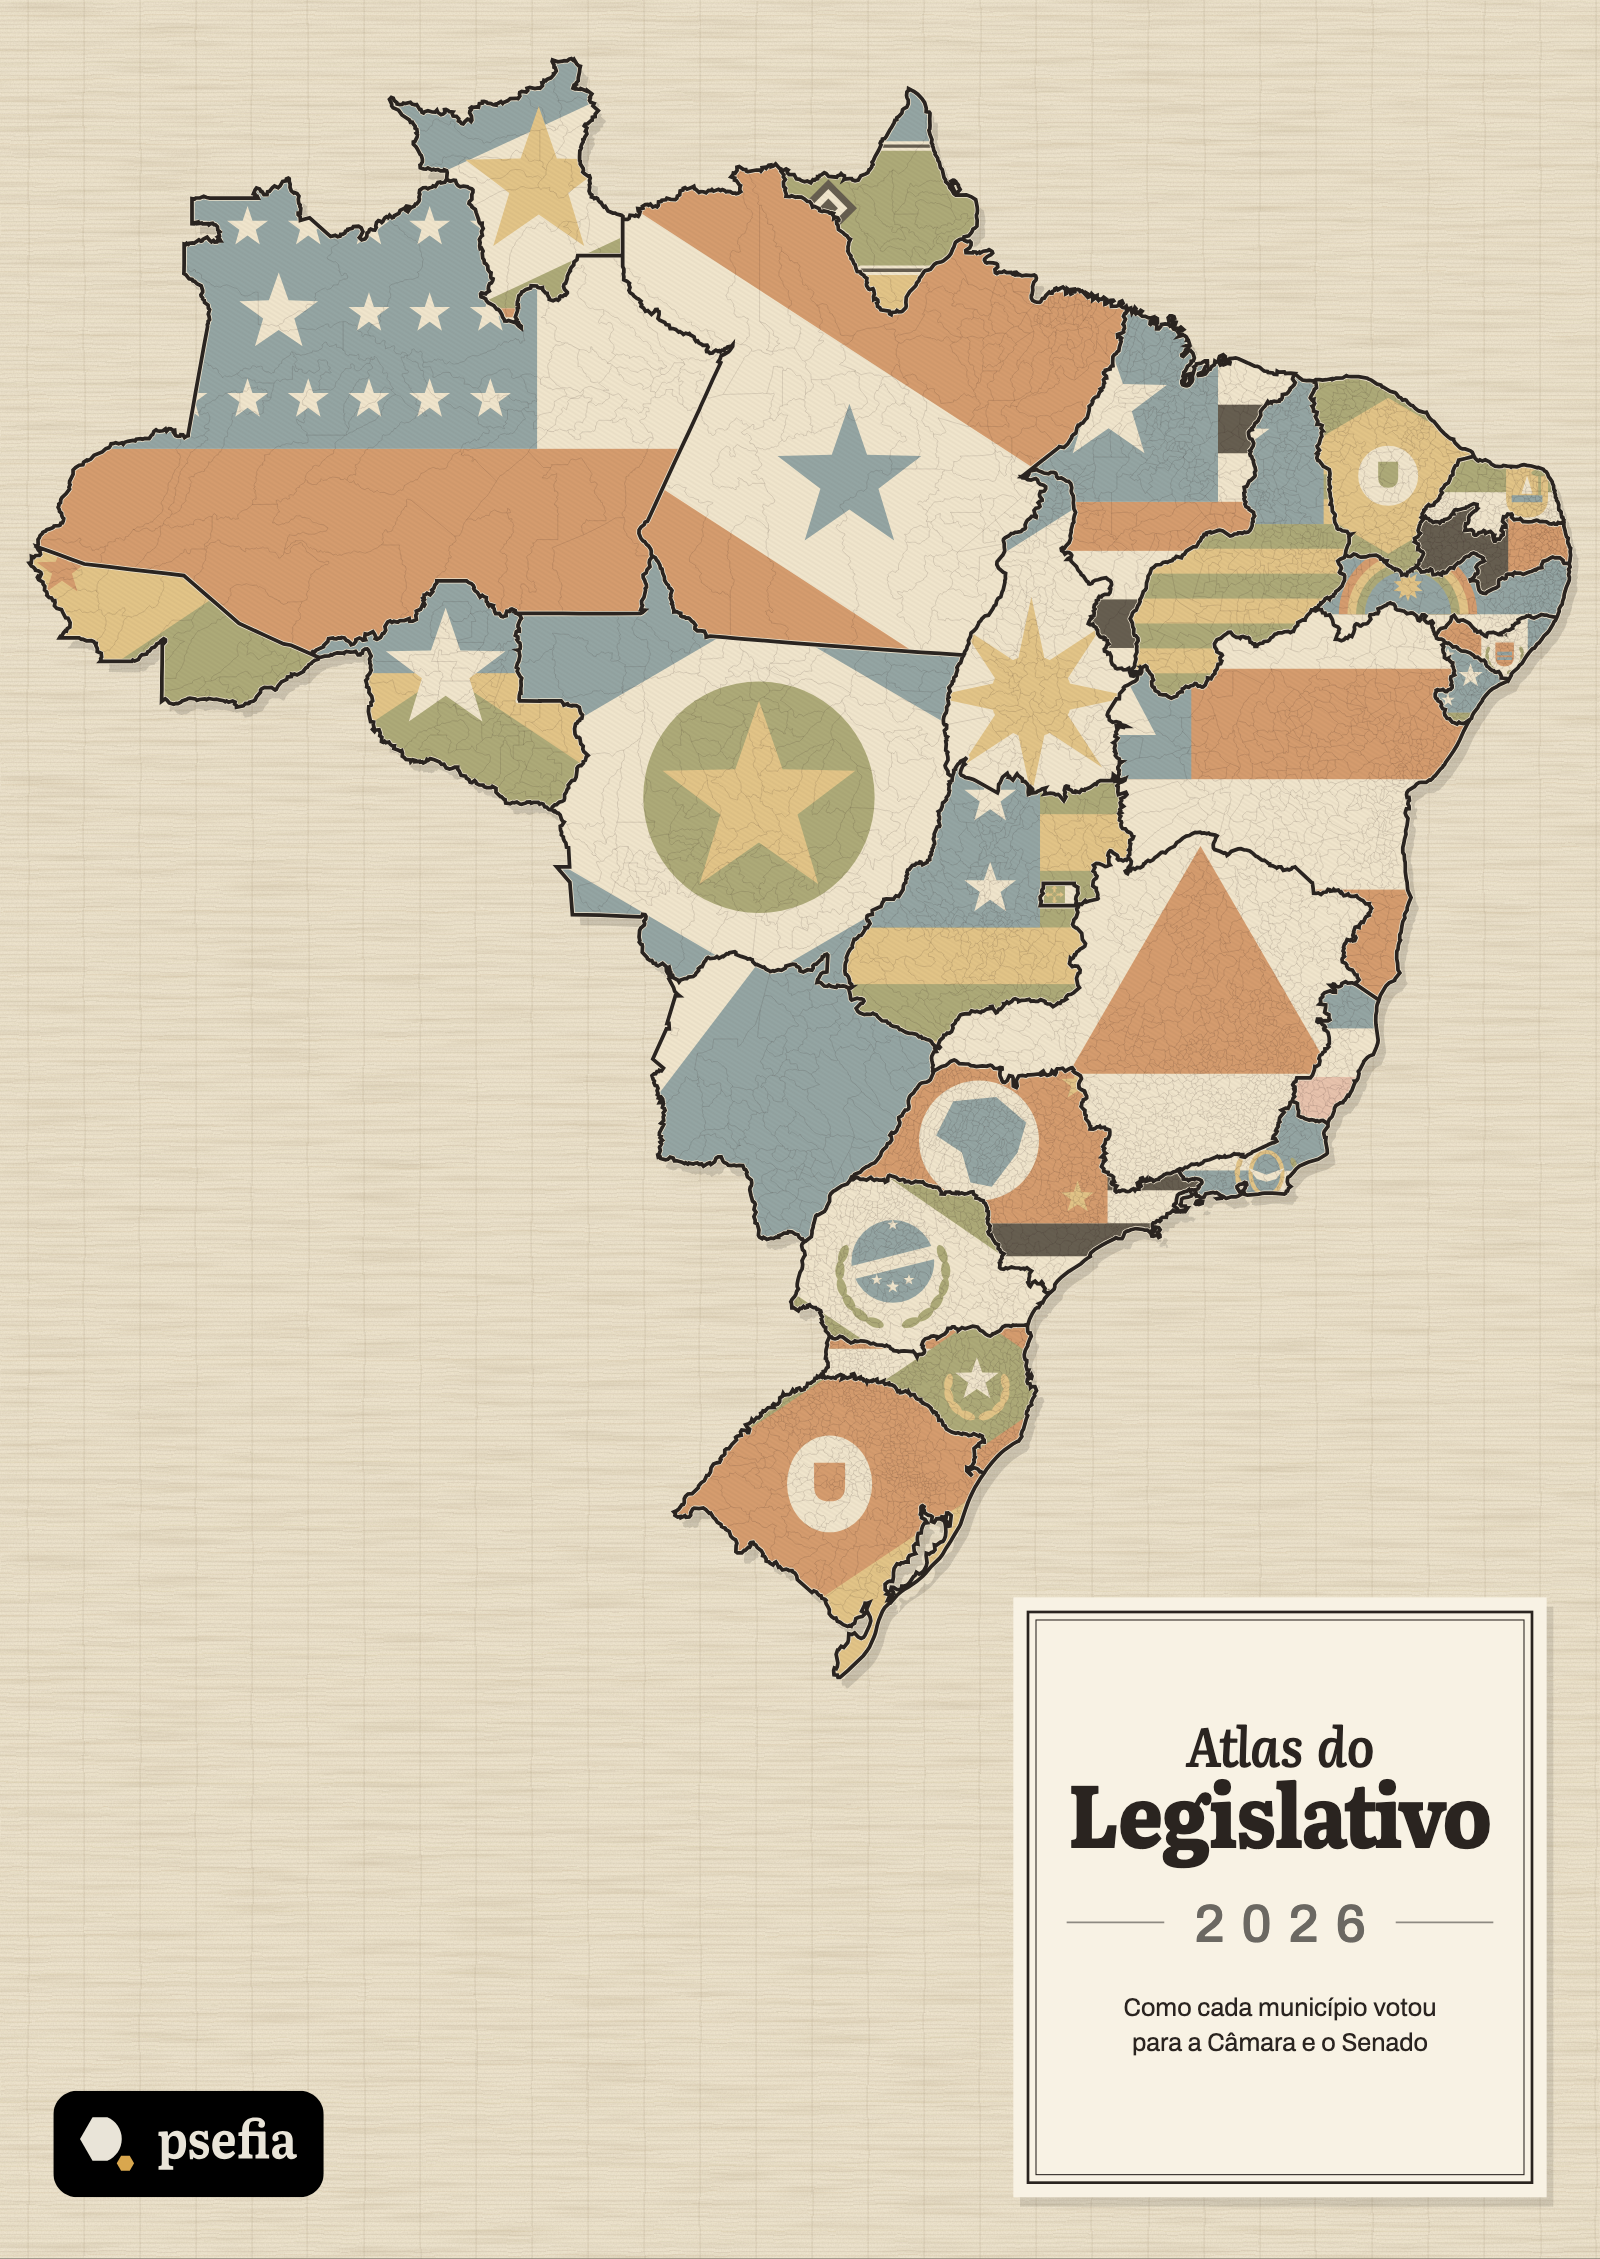
Atlas do Legislativo 2026
How each municipality voted for the Chamber and the Senate (in Portuguese)
Your city’s vote, explained and compared.
- Publisher
- Psefia
- Formats
- Animated web edition · EPUB
- ISBN
- [placeholder: ISBN to be registered]
5.571
municipalities, one per spread
27
parts, one per state
About the book
Your city’s vote, explained and compared: the 5,571 Brazilian municipalities in the 2026 elections, one per spread. Animated web edition, sold on the site. The book is in Portuguese.
Contents
- Part 1 Acre
- Part 2 Amapá
- Part 3 Amazonas
- Part 4 Pará
- Part 5 Rondônia
- Part 6 Roraima
- Part 7 Tocantins
- Part 8 Alagoas
- Part 9 Bahia
- Part 10 Ceará
- Part 11 Maranhão
- Part 12 Paraíba
- Part 13 Pernambuco
- Part 14 Piauí
- Part 15 Rio Grande do Norte
- Part 16 Sergipe
- Part 17 Distrito Federal
- Part 18 Goiás
- Part 19 Mato Grosso
- Part 20 Mato Grosso do Sul
- Part 21 Espírito Santo
- Part 22 Minas Gerais
- Part 23 Rio de Janeiro
- Part 24 São Paulo
- Part 25 Paraná
- Part 26 Rio Grande do Sul
- Part 27 Santa Catarina
Brazil in flags and municipalities
Each state appears in its flag; in the other views, one dot per municipality over the faded flag. Scroll to change the view or use the buttons; the list of states opens each part.
Each state in its flag
The states, each dressed in its own flag, as on the cover.
Five regions
North, Northeast, Centre-West, Southeast and South. The book follows this order, one part per state.
The most voted party in each city
For federal deputy, first round of 2026: one dot per municipality, in the colour of the most voted party.
Preview: one state and one municipality
A sample with real data: the opening of Roraima and the page of Boa Vista. The rest of the book is for buyers.
Delegation in the Chamber de Roraima
Most voted party in each municipality: Roraima
Roraima · IBGE 1400100
Boa Vista
Population: 500.965 (2026) · 240.595 eligible voters
Abstention
17,4%
- Abstention
Abstention. Use the arrow keys to read each value.
41.833 / 240.595 eligible voters
Valid votes for elected
36,9%
- Valid votes for elected
Valid votes for elected. Use the arrow keys to read each value.
Party-only vote
2,3%
- Party-only vote
Party-only vote. Use the arrow keys to read each value.
Most voted parties
- Most voted parties
Most voted parties. Use the arrow keys to read each value.
Blank and null
5,2%
- Blank and null
Blank and null. Use the arrow keys to read each value.
Most voted federal deputies
| Name | Party | % |
|---|---|---|
Ítalo Otávioelected | REPUBLICANOS | 7,1% |
Daniel Trindadeelected | PL | 6,0% |
Rodrigo Mesquitaelected | PODE | 5,2% |
Pastor Dinizsubstitute | UNIÃO | 5,2% |
Athally Albuquerquesubstitute | REPUBLICANOS | 5,0% |
Defensor Stélio Denerelected | UNIÃO | 4,3% |
Senate: most voted in the municipality
- Senate: most voted in the municipality
Senate: most voted in the municipality. Use the arrow keys to read each value.
The municipality in numbers
PIB per capita
R$ 38.782
- PIB per capita
PIB per capita. Use the arrow keys to read each value.
↑ 64% · 3º/15 RR · 2023 · Source: IBGE
PIB
18.234R$ mi
- PIB
PIB. Use the arrow keys to read each value.
↑ 98% · 1º/15 RR · 2023 · Source: IBGE
PIB real, 2013→2023
51,8%
- PIB real, 2013→2023
PIB real, 2013→2023. Use the arrow keys to read each value.
↑ 78% · 9º/15 RR · 2013 · Source: IBGE (IPCA)
Agropecuária no valor adicionado
1,6%
- Agropecuária no valor adicionado
Agropecuária no valor adicionado. Use the arrow keys to read each value.
↓ 93% · 15º/15 RR · 2021 · Source: IBGE
Indústria no valor adicionado
11,0%
- Indústria no valor adicionado
Indústria no valor adicionado. Use the arrow keys to read each value.
↑ 62% · 2º/15 RR · 2021 · Source: IBGE
Administração pública no valor adicionado
40,2%
- Administração pública no valor adicionado
Administração pública no valor adicionado. Use the arrow keys to read each value.
↑ 70% · 14º/15 RR · 2021 · Source: IBGE
Crédito rural contratado per capita
R$ 276
- Crédito rural contratado per capita
Crédito rural contratado per capita. Use the arrow keys to read each value.
↓ 85% · 12º/15 RR · 2025 · Source: BCB/SICOR
Valor da produção agrícola
230R$ mi
- Valor da produção agrícola
Valor da produção agrícola. Use the arrow keys to read each value.
↑ 82% · 3º/15 RR · 2024 · Source: IBGE (PAM)
Eleitores
241.158
- Eleitores
Eleitores. Use the arrow keys to read each value.
↑ 99% · 1º/15 RR · 2026 · Source: TSE
Mulheres no eleitorado
52,7%
- Mulheres no eleitorado
Mulheres no eleitorado. Use the arrow keys to read each value.
↑ 87% · 1º/15 RR · 2026 · Source: TSE
Eleitores de 16 a 24 anos
17,0%
- Eleitores de 16 a 24 anos
Eleitores de 16 a 24 anos. Use the arrow keys to read each value.
↑ 91% · 15º/15 RR · 2026 · Source: TSE
Eleitores com 60 anos ou mais
15,4%
- Eleitores com 60 anos ou mais
Eleitores com 60 anos ou mais. Use the arrow keys to read each value.
↓ 97% · 12º/15 RR · 2026 · Source: TSE
Superior completo (declarado)
13,6%
- Superior completo (declarado)
Superior completo (declarado). Use the arrow keys to read each value.
↑ 93% · 1º/15 RR · 2026 · Source: TSE
Analfabeto ou só lê e escreve
4,5%
- Analfabeto ou só lê e escreve
Analfabeto ou só lê e escreve. Use the arrow keys to read each value.
↓ 89% · 15º/15 RR · 2026 · Source: TSE
Eleitores por habitante
48,1%
- Eleitores por habitante
Eleitores por habitante. Use the arrow keys to read each value.
↓ 99% · 13º/15 RR · 2026 · Source: TSE; IBGE
FPM per capita
R$ 1.761
- FPM per capita
FPM per capita. Use the arrow keys to read each value.
↓ 59% · 1º/15 RR · 2025 · Source: STN; IBGE
FUNDEB per capita
R$ 1.127
- FUNDEB per capita
FUNDEB per capita. Use the arrow keys to read each value.
↓ 53% · 13º/15 RR · 2025 · Source: STN; IBGE
Transferências federais per capita
R$ 2.893
- Transferências federais per capita
Transferências federais per capita. Use the arrow keys to read each value.
↓ 68% · 4º/15 RR · 2025 · Source: STN; IBGE
CAPAG (nota do Tesouro)
A
↑ 69% · 1º/9 RR · 2025 · Source: STN (CAPAG)
Cobertura da rede de água
99,9%
- Cobertura da rede de água
Cobertura da rede de água. Use the arrow keys to read each value.
↑ 50% · 7º/15 RR · 2020 · Source: ANA (Atlas Águas)
Horas sem energia (DEC)
8,1h/ano
- Horas sem energia (DEC)
Horas sem energia (DEC). Use the arrow keys to read each value.
↓ 78% · 15º/15 RR · 2025 · Source: ANEEL
Nascidos vivos por mil hab.
14,7‰
- Nascidos vivos por mil hab.
Nascidos vivos por mil hab.. Use the arrow keys to read each value.
↑ 90% · 7º/15 RR · 2024 · Source: IBGE (Registro Civil)
Óbitos por mil hab.
4,3‰
- Óbitos por mil hab.
Óbitos por mil hab.. Use the arrow keys to read each value.
↓ 93% · 1º/15 RR · 2024 · Source: IBGE (Registro Civil)
Óbitos por causa não natural
7,7%
- Óbitos por causa não natural
Óbitos por causa não natural. Use the arrow keys to read each value.
↑ 57% · 8º/15 RR · 2024 · Source: IBGE (Registro Civil)
Pessoas no Cadastro Único
46,1%
- Pessoas no Cadastro Único
Pessoas no Cadastro Único. Use the arrow keys to read each value.
↓ 70% · 15º/15 RR · 2026 · Source: MDS (MI Social); IBGE
Pessoas no Bolsa Família
22,4%
- Pessoas no Bolsa Família
Pessoas no Bolsa Família. Use the arrow keys to read each value.
↓ 56% · 15º/15 RR · 2026 · Source: MDS (MI Social); IBGE
Famílias em extrema pobreza por mil hab.
28,5/mil hab.
- Famílias em extrema pobreza por mil hab.
Famílias em extrema pobreza por mil hab.. Use the arrow keys to read each value.
↓ 76% · 15º/15 RR · 2026 · Source: MDS (CadÚnico); IBGE
CRAS por 100 mil hab.
1,6/100 mil
- CRAS por 100 mil hab.
CRAS por 100 mil hab.. Use the arrow keys to read each value.
↓ 99% · 15º/15 RR · 2026 · Source: MDS (CadSUAS); IBGE
OSCs ativas por 10 mil hab.
43,8/10 mil
- OSCs ativas por 10 mil hab.
OSCs ativas por 10 mil hab.. Use the arrow keys to read each value.
↓ 76% · 4º/15 RR · 2026 · Source: Ipea (Mapa das OSCs); IBGE
Motos na frota
41,0%
- Motos na frota
Motos na frota. Use the arrow keys to read each value.
↑ 58% · 14º/15 RR · 2026 · Source: Senatran
CNPJs ativos por mil hab.
85,3‰
- CNPJs ativos por mil hab.
CNPJs ativos por mil hab.. Use the arrow keys to read each value.
↓ 54% · 1º/15 RR · 2026 · Source: Receita Federal
Estabelecimentos com vínculo formal por mil hab.
12,6‰
- Estabelecimentos com vínculo formal por mil hab.
Estabelecimentos com vínculo formal por mil hab.. Use the arrow keys to read each value.
↓ 60% · 1º/15 RR · 2024 · Source: RAIS
Veículos por 100 hab.
53,9/100 hab.
- Veículos por 100 hab.
Veículos por 100 hab.. Use the arrow keys to read each value.
↓ 52% · 1º/15 RR · 2026 · Source: Senatran
Beneficiários do BPC
4,0%
- Beneficiários do BPC
Beneficiários do BPC. Use the arrow keys to read each value.
↑ 87% · 1º/15 RR · 2026 · Source: MDS (BPC)
Escolas de educação básica por 10 mil hab.
5,4/10 mil
- Escolas de educação básica por 10 mil hab.
Escolas de educação básica por 10 mil hab.. Use the arrow keys to read each value.
↓ 98% · 15º/15 RR · 2024 · Source: INEP
Matrículas na educação básica por mil hab.
208,8‰
- Matrículas na educação básica por mil hab.
Matrículas na educação básica por mil hab.. Use the arrow keys to read each value.
↑ 60% · 12º/15 RR · 2024 · Source: INEP
População atendida por rede de água
97,0%
- População atendida por rede de água
População atendida por rede de água. Use the arrow keys to read each value.
↑ 89% · 1º/15 RR · 2024 · Source: SINISA
Estabelecimentos de saúde por 10 mil hab.
22,0/10 mil
- Estabelecimentos de saúde por 10 mil hab.
Estabelecimentos de saúde por 10 mil hab.. Use the arrow keys to read each value.
↓ 51% · 8º/15 RR · 2026 · Source: CNES
Perdas na distribuição de água
57,8%
- Perdas na distribuição de água
Perdas na distribuição de água. Use the arrow keys to read each value.
↑ 89% · 15º/15 RR · 2024 · Source: SNIS
What you get
The complete animated web edition: 27 states and 5,571 municipality pages
Each state’s opening: delegation, party map and elected deputies
Each municipality with abstention, valid votes for elected candidates, parties, deputies, Senate and 40 indicators compared with the state and the country
Search by municipality and links to share with others who have access
Updates to this edition at no cost
Buy access
The site sells access to the animated web edition: the 27 states and 5,571 municipalities, with charts that build up on screen.
Payment through Stripe. For now checkout runs in test mode: no card is charged.
Complete web edition
All 27 states and 5,571 municipalities.
Price to be announced
Also as an ebook
The EPUB edition is sold in ebook stores. Stores: links coming soon
Formats
Animated web edition
Sold hereRead on the site, with charts that build up on screen. Sold here.
EPUB
In storesReflowable ebook, for e-readers and phones.
How to read a municipality page
1. The big number is the municipality’s
Abstention, valid votes for elected candidates, party-only votes: the highlighted value is always the city’s.
2. The pills compare
They show the state and the country. For indicators, they are the median of the municipalities.
3. The position line
“↑ 87% · 1st/15 RR” means: higher than in 87% of the country’s municipalities and first of 15 in the state.
Sources and method
Every number comes from a versioned SQL query on lakebrasil, with its original source: TSE for the election; IBGE and other agencies for the indicators.
Data lakebrasil · lake [placeholder]
Collective work organised by Psefia. TSE data under Creative Commons Attribution (CC BY); other sources and licences in the book’s glossary. Non-partisan, unofficial publication.